Welcome to WordPress. This is your first post. Edit or delete it, then start writing!
Blog
-

Deskless Worker Productivity Strategies That Remove Friction
More than half of U.S. workers in production occupations were required to maintain a consistently fast work pace in 2023, according to the U.S. Bureau of Labor Statistics occupational requirements data. Many frontline teams are already moving quickly; the bigger productivity problem is often the system around the work, not employee effort.
The strongest deskless worker productivity strategies focus on removing avoidable friction: faster access to schedules and instructions, less app switching, training that fits active shifts, predictable staffing, and simple ways to report problems.
Why Deskless Productivity Breaks Differently
A tool that works for an office employee can slow a warehouse associate if it requires a desktop login, several passwords, long forms, or multiple apps.
The Bureau of Labor Statistics measures labor productivity by comparing output with hours worked. For frontline operations, the practical goal is therefore to increase useful output without simply adding labor time. That usually means cutting waiting, rework, searching, handoffs, and preventable errors.
Start With a Mobile-First Work Hub
Schedules, time-off requests, shift swaps, task updates, training, HR questions, and urgent announcements should be easy to reach from one place.
Test tools under real conditions. Can an employee use them while wearing gloves? Do critical job aids remain available when connectivity drops? Can workers without corporate email sign in easily?
Offline access matters for basements, large facilities, rural sites, warehouses with weak signals, and field crews. Mobile-first systems should reduce steps rather than simply moving a complicated desktop workflow onto a smaller screen.
Make Training Short and Close to the Task

Long desktop courses are a poor fit for shifts built around customers, equipment, patients, deliveries, or production targets.
Short modules work better when each teaches one behavior: complete a safety check, use a scanner function, handle a new return process, or respond to an equipment alert.
Research published through the National Bureau of Economic Research examined a randomized training program for frontline workers at a government agency. Trained employees increased their output and needed less managerial assistance. The researchers estimated that spillover benefits to managers accounted for about 45% of the program’s total gains.
The study was conducted outside the United States, so the result is not a universal forecast. Effective training can nevertheless reduce repetitive troubleshooting and free supervisors for higher-value work.
Treat Scheduling as a Productivity System
Schedule quality influences fatigue, handoffs, team familiarity, coverage, and the time managers spend fixing gaps.
The NIOSH Center for Work and Fatigue Research reports that nearly 30% of the American workforce has a schedule outside a regular daytime shift. NIOSH also notes that fatigue can slow reaction time, reduce attention, limit short-term memory, and impair judgment.
That makes predictable scheduling an operational issue, not merely an employee perk.
Publish schedules as early as practical, make availability updates easy, set clear rules for shift swaps, monitor excessive consecutive shifts, and watch overtime by employee and role.
Research and operational work from MIT Sloan on frontline work systems also emphasizes stable schedules, cross-training, simplified operations, and greater worker empowerment as ways to improve frontline performance.
Build Two-Way Communication

Frontline communication fails when headquarters can send messages but workers cannot easily respond.
The Occupational Safety and Health Administration’s worker-participation guidance notes that workers often have valuable knowledge about hazards and operational problems because they experience them directly. Effective programs provide information, invite reporting, respond to concerns, and remove barriers such as language differences, lack of time, or fear of retaliation.
The same principle applies outside safety. A warehouse worker may notice recurring scanner failures before management sees them in reports. A restaurant employee may know why a particular handoff consistently slows service.
Frontline feedback should therefore feed directly into process improvement.
Use a 60-Second Frontline Friction Audit
A simple audit can reveal where productivity is leaking. Ask five questions about any recurring workflow:
- Can the worker find the information needed in under a minute?
- Can the task be completed without jumping between several systems?
- Does the process still work with poor connectivity?
- Can the employee report a problem without leaving the work area?
- Does the manager receive enough information to fix the cause?
If two or more answers are “no,” the workflow is a strong redesign candidate.
Productivity leak Worker experience Better response Information friction Searching for procedures One mobile access point Schedule friction Last-minute gaps Earlier schedules and controlled swaps Training friction Long, detached courses Short role-based modules Communication friction One-way messages Alerts plus feedback channels Fatigue friction Slower reactions, more errors Review shift length and overtime Measure Results Without Surveillance Friction
Productivity measurement should show whether work is improving, not merely whether employees look busy.
Choose metrics that fit the job. Retail teams might track wait times and stocking accuracy. Field-service organizations may monitor first-time fix rate. Warehouses can combine units processed with error and damage rates.
Avoid relying on a single speed metric. Faster work that produces additional defects, injuries, customer complaints, or repeat visits is not a genuine productivity gain.
A balanced frontline scorecard can combine one output measure, one quality measure, one safety measure, and one workforce measure such as unplanned overtime or absenteeism.
Recognition Should Reward the Right Things

Recognition should reinforce problem-solving, safe work, coaching, reliability, learning, and customer recovery—not only raw speed.
OSHA specifically cautions that incentive programs should not discourage employees from reporting injuries, illnesses, or hazards. If workers believe speaking up will cost them rewards, reported performance may improve while underlying risk increases.
Where These Strategies Can Fail
Technology cannot compensate for chronic understaffing, unrealistic targets, poor equipment, or policies that give workers responsibility without authority.
Mobile-first also does not mean mobile-only. Some teams still need shared kiosks, printed backup procedures, translated materials, accessibility support, or manager-assisted workflows.
Flexibility needs guardrails as well. Unlimited shift swapping can create skill gaps, overtime, or uneven coverage unless eligibility, qualifications, and approval rules are built into the process.
The best deskless worker productivity strategies are operational, not merely digital. Technology like AI is reshaping workflows and redefining jobs. It should make good work easier rather than add another administrative layer.
Frequently Asked Questions
1. What is the fastest way to improve deskless worker productivity?
Remove one repeated friction point, such as schedule confusion, missing instructions, or app switching. Small workflow fixes can outperform another performance target.
2. How should companies measure deskless productivity?
Combine output with quality, safety, and labor measures. Track productivity alongside errors, incidents, overtime, rework, and customer outcomes.
3. Are mobile apps necessary for frontline teams?
Not always. Mobile tools help when they reduce access barriers, but shared devices, kiosks, offline materials, and printed procedures may still be necessary.
4. How does scheduling affect productivity?
Poor scheduling can increase fatigue, coverage gaps, overtime, and handoff problems. Predictable schedules help managers maintain steadier teams and reduce disruption.
Final Takeaway
The most productive deskless teams are not necessarily the ones moving fastest. They are the ones spending less time waiting for information, fixing avoidable errors, chasing schedule changes, repeating training, or trying to get a manager’s attention.
Use that as the test for any productivity initiative: does it make the job easier to execute correctly on the first attempt? Start with one high-friction workflow, measure the delay or rework it creates, and redesign that process before buying more technology. When systems fit active shifts, productivity becomes a result of better work design rather than more pressure.
-

Applying Lean Principles to Shift Work and Workforce Output Without Burning Out Your Team
A shift can be fully staffed and still waste hours of productive capacity. Employees wait for materials, supervisors repeat the same handoff conversations, work piles up at one station, and another team produces more than the next process can handle.
That is why applying lean principles to shift work and workforce output is less about squeezing more labor from every hour and more about removing the conditions that prevent people from doing useful work.
Lean thinking traditionally revolves around five ideas: define customer value, understand the value stream, create flow, use demand-driven pull, and keep improving the system. The Lean Enterprise Institute describes these principles as a continuous process rather than a one-time efficiency project.
For US employers operating warehouses, manufacturing plants, healthcare facilities, service businesses, or other multi-shift workplaces, those ideas can be applied directly to workforce design.
Stop Measuring Staffing Before You Measure Waste
Traditional workforce planning often begins with a question: How many people should be scheduled?
Lean management asks a better question first: What prevents the people already scheduled from creating value?
ASQ identifies classic lean wastes such as waiting, unnecessary motion, excess inventory, over-processing, overproduction, transportation, and defects. Those categories translate surprisingly well to labor.
Waiting might mean an operator standing idle because parts have not arrived. Motion could be employees repeatedly walking across a warehouse for tools. Over-processing may appear as managers entering the same scheduling information into multiple systems. Defects can include rework caused by rushed or poorly trained employees.
Overstaffing is wasteful, but understaffing is not lean either. It can merely move costs elsewhere through overtime, errors, absenteeism, fatigue, delayed orders, and turnover.
OSHA specifically recommends examining workload, work hours, staffing levels, absences, and opportunities for adequate rest when addressing workplace fatigue.
Map the Shift Instead of Treating Eight Hours as One Block
One of the most useful lean tools for workforce planning is value-stream mapping.
NIST explains that value-stream mapping documents materials, processes, and information flows so organizations can identify waste, shorten lead times, and design a better future state.
For shift work, managers can adapt the same idea by tracking an entire shift in time blocks.
Imagine a distribution operation running from 7 a.m. to 3 p.m. Employees clock in at 7, but picking does not reach normal speed until 7:35 because scanners are being assigned and replenishment has not finished. At noon, packers begin waiting because picking slows during staggered lunches. From 2:30 onward, production declines because workers begin paperwork and cleanup at different times.
The problem is not necessarily the number of workers. The flow of work is poorly designed.
Use a Simple Shift-Flow Test

Record five things for each major period of the shift: customer demand, available workers, productive output, waiting or delay time, and the cause of the delay.
Then ask three questions. Is this activity creating customer value? Is it necessary even though it does not directly create value? Could it be eliminated, moved, automated, combined, or performed at another time? A pattern usually becomes visible within several shifts.
Let Demand Pull Labor Instead of Pushing Labor Into Fixed Rosters
A conventional schedule often repeats last week’s staffing pattern. Lean systems attempt to align resources more closely and adopt with actual demand.
That does not mean sending employees home whenever volume dips. It means understanding demand well enough to place capacity where it creates the greatest value.
A restaurant might schedule more cross-trained staff around lunch demand. A warehouse might shift labor toward receiving when inbound volume rises, then redeploy workers to fulfillment later. A plant could move qualified employees between cells when one line develops a backlog.
The principle is similar to lean pull production: downstream demand should signal what upstream resources need to provide rather than producing simply because capacity exists.
Cross-training makes this substantially easier because managers gain flexible capacity without automatically adding headcount.
A Practical Lean Shift Scorecard
Measure What It Reveals Warning Sign Output vs. demand Whether capacity matches requirements Chronic backlog or excess production Cycle time vs. takt time Where flow cannot meet demand Cycle time repeatedly exceeds takt Waiting time Process interruptions Repeated material, approval, or equipment delays Rework/error rate Quality instability Output rises while errors also rise Overtime/fatigue indicators Whether productivity is sustainable Output depends on extended hours Handoff delays Shift-transition efficiency Incoming crews repeatedly restart or investigate work Managers should examine these measures together. Improving output while errors, injuries, overtime, or fatigue rise is not meaningful lean improvement.
Standardize Shift Handoffs Before Adding More Overlap
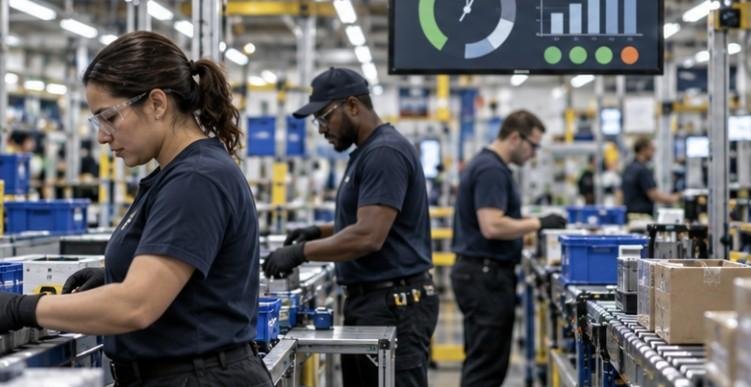
Shift changes can quietly consume substantial labor. The outgoing team explains equipment problems. The incoming supervisor searches for unfinished orders. Workers discover that tools have moved. Production resumes slowly while everyone reconstructs what happened.
Standard work can reduce that variation. A useful handoff should communicate current production status, unresolved quality problems, equipment conditions, safety issues, urgent orders, material shortages, and ownership of unfinished work.
Visual management makes the process faster. A physical or digital board showing completed, active, delayed, and blocked work can reduce dependence on long verbal briefings.
However, managers should not impose an arbitrary 15-minute target when the operation requires a longer safety-critical handoff. Healthcare, transportation, utilities, chemical processing, and other high-risk environments may require additional verification. Lean removes unnecessary communication, not necessary communication.
Protect Flow From Fatigue
This is where workforce lean projects sometimes go wrong. Reducing “idle” time until every minute is occupied can look efficient on a spreadsheet while making the real system less reliable.
NIOSH states that fatigue can slow reaction time, reduce concentration, limit short-term memory, and impair judgment. Night work and extended hours are among the workplace factors associated with fatigue.
Therefore, applying lean principles to shift work and workforce output must include recovery time, reasonable workload, appropriate breaks, and enough staffing to absorb normal operational variation.
A worker waiting because a process is broken represents waste. A worker taking a planned recovery break during demanding work does not. That distinction matters.
Build Continuous Improvement Into Every Shift

Lean systems become stronger when frontline employees help redesign them. Workers usually know where the frustrating delays occur. They know which scanner fails repeatedly, which form duplicates another form, which rack location creates unnecessary walking, and which shift handoff routinely loses information.
Short improvement conversations can turn that experience into operational knowledge. Instead of asking employees only whether they hit yesterday’s target, supervisors can ask what prevented flow, what created rework, where waiting occurred, and what small experiment could improve the next shift.
Managers can reinforce this through regular Gemba walks: observing work where it actually occurs rather than relying exclusively on reports. The goal is not a giant transformation every month. It is repeatedly finding small constraints and removing them.
Frequently Asked Questions
1. What is lean workforce management?
Lean workforce management aligns people and processes with customer demand while reducing waiting, rework, unnecessary motion, excess processing, and other forms of operational waste.
2. Does lean scheduling mean scheduling fewer employees?
No. Lean scheduling seeks appropriate capacity. Cutting staffing below safe or sustainable levels can create delays, quality problems, overtime, fatigue, and additional costs.
3. How is takt time used in workforce planning?
Takt time shows how frequently work must be completed to satisfy demand. Managers compare it with actual cycle times to identify overloaded processes and capacity gaps.
4. Can lean principles work outside manufacturing?
Yes. Value-stream mapping, standardized work, flow, pull, visual management, and continuous improvement can also apply to healthcare, logistics, hospitality, administrative work, and other service environments.
Better Output Starts With Better Flow
The most valuable insight from applying lean principles to shift work and workforce output is that poor productivity is not automatically a people problem. Frequently, the system makes productive work unnecessarily difficult.
Start with one shift. Map where time actually goes, calculate the demand rate, identify the largest source of waiting or rework, and fix that constraint before changing headcount. Then measure what happens to throughput, quality, safety, overtime, and employee workload.
A lean workforce is not one that stays busy every second. It is one in which people can consistently move valuable work forward with fewer obstacles.
-

How to Manage Shift Swap Productivity Loss Without Killing Flexibility
A shift can be fully staffed on paper and still perform badly. The problem is not the swap itself; it is what the swap changes—experience, overtime exposure, recovery time, team balance, and handoff quality. That is why learning how to manage shift swap productivity loss matters in US restaurants, retail, healthcare, warehouses, call centers, and other hourly operations.
The best system is neither “approve everything” nor “ban swaps.” It lets employees solve schedule conflicts while protecting the conditions required for good work.
Why Full Coverage Can Still Produce Less Output
Managers often ask only whether someone took the shift. Productivity is more complicated.
A capable worker may be replaced by someone who needs more supervision. A night worker may accept an early shift with too little recovery. Another employee may cross the 40-hour threshold and create overtime.
OSHA reports that injury rates are 18% higher on evening shifts and 30% higher on night shifts than on day shifts, while 12-hour workdays have been associated with a 37% higher injury risk. Fatigue can also impair concentration, memory, judgment, and alertness. A “covered” shift can therefore still be operationally weak.
Approve Swaps by Risk, Not Preference
A productive policy should make approval predictable. Three checks matter most: capability, hours, and recovery.
Match Capability, Not Just Job Title
Two employees with the same title are not always interchangeable. A restaurant may need a certified closer, a warehouse may need forklift authorization, and a retail location may need a keyholder.
The replacement should be qualified for every critical duty. This reduces delays, reassignment, extra supervision, and last-minute role changes.
Managers can make this easier by defining the minimum skills for each shift before swap requests appear. Employees should see which shifts they are eligible to accept rather than discovering restrictions after a trade has already been arranged.
Check Weekly Hours Before Approval
For covered, nonexempt employees, the Fair Labor Standards Act generally requires overtime pay at not less than 1.5 times the regular rate after 40 hours in a workweek.
A swap that adds overtime may still be worth approving when coverage is scarce, but managers should see that cost before approving it and compare it with the likely cost of understaffing.
The important distinction is between unavoidable overtime and invisible overtime. A scheduling system should flag the latter before the trade becomes final.
Protect Recovery Time

A swap can create a “quick return,” such as closing late and returning early. A review of shift-work research found that quick returns were associated with greater fatigue, while overtime was associated with decreased job performance.
Harvard Medical School also explains that night and rotating work can disrupt the circadian system, making it harder to sleep during recovery periods and harder to remain alert while working.
For safety-sensitive or physically demanding jobs, recovery time is a productivity control, not only a wellness issue.
Use a Five-Gate Shift Swap Test
Run every request through the same five checks.
Gate Ask Escalate When Coverage Will required staffing remain intact? Headcount falls below minimum Skill Can the replacement handle critical duties? Training or credential gap exists Hours Does the swap create overtime? Cost rises materially Recovery Is there enough time between shifts? Turnaround becomes fatigue-prone Workflow Will leadership or handoffs suffer? Critical knowledge disappears If a request passes all five, approval can be quick. If one fails, a manager reviews the exception.
This approach to how to manage shift swap productivity loss turns a subjective scheduling decision into a repeatable operating rule. It also makes decisions easier to explain to employees because approval is tied to defined operational conditions rather than individual manager preference.
Set a Notice Window but Keep an Emergency Path
A 24- to 48-hour deadline gives managers time to check qualifications, hours, and coverage. Scheduling software can enforce deadlines, route requests to eligible coworkers, and block trades that break configured rules.
But rigid deadlines can backfire during illness, caregiving problems, or transportation failures. Separate routine swaps from emergencies: normal trades follow the deadline; urgent cases use an escalation path.
This distinction protects flexibility without allowing every last-minute preference to become an emergency.
Transfer Accountability After Approval

Once a trade is approved and the schedule updates, responsibility should transfer clearly to the accepting employee under the employer’s attendance rules.
The approved schedule should become the single source of truth for the worker, manager, payroll, and timekeeping system. That reduces duplicate messages and “I thought they were covering it” no-shows.
Employees should also receive confirmation when the trade becomes official. A conversation between coworkers should not count as an approved swap until the scheduling system or manager confirms it.
Let Software Enforce the Rules
Platforms such as When I Work and similar workforce tools can centralize requests, update schedules, and enforce policy.
Configure the system to flag swaps that create overtime, assign unqualified workers, leave required roles uncovered, or violate recovery-time rules.
The National Safety Council notes that fatigue can reduce attention, vigilance, memory, reaction time, judgment, and overall job productivity.
Software cannot remove fatigue, but it can prevent avoidable schedule patterns from creating more of it. Technology works best after managers define sensible rules; automation should enforce policy rather than replace judgment.
Measure Whether Swaps Are Actually Hurting Performance
Do not assume frequent swaps automatically mean poor productivity. Measure the outcome. For four to six weeks, compare swapped shifts with unchanged shifts using two or three metrics relevant to your operation: sales per labor hour, orders processed, average handle time, picking errors, customer complaints, rework, safety incidents, or overtime dollars.
Use:
Productivity change (%) = ((swapped-shift output − normal output) ÷ normal output) × 100
If a team normally processes 500 orders but swapped shifts average 460, the observed difference is -8%.
That does not prove the swaps caused the decline. Workload, staffing volume, demand, equipment problems, and other factors may also matter. It does, however, identify a pattern worth investigating.
Managers can then look for the common factor: inexperienced replacements, overtime, short recovery windows, poor handoffs, or particular shifts that are difficult to cover successfully.
Where Strict Swap Rules Can Backfire

Too much control creates its own productivity problem. Employees who cannot resolve ordinary conflicts may call out, quit, or arrive distracted.
Not every swap requires identical experience either. A slower shift can support cross-training if supervision and safety requirements are covered.
Use proportional control. High-risk shifts need stricter skill and fatigue checks; lower-risk shifts can allow more flexibility. A hospital night shift, for example, demands different controls from a lightly staffed retail shift during a quiet period.
Frequently Asked Questions
1. How much notice should employees give for a shift swap?
A 24- to 48-hour window works for routine requests. Keep an exception path for emergencies and follow applicable state, local, union, or contract requirements.
2. Should managers approve swaps that create overtime?
Only after comparing the overtime cost with the operational cost of understaffing. Federal overtime rules generally apply to covered nonexempt employees after 40 hours in a workweek.
3. Can shift swaps reduce productivity even with full staffing?
Yes. Skill mismatch, short recovery time, overtime, weak handoffs, and loss of experienced coverage can reduce output even when headcount stays unchanged.
4. What is the best way to manage shift swap productivity loss?
Use a consistent approval test covering staffing, qualifications, hours, recovery time, and workflow impact, then track swapped-shift performance for recurring problems.
The Goal Is Better Coverage, Not Fewer Swaps
Shift swapping becomes expensive when managers measure only whether someone filled an empty slot. The better question is whether the replacement preserved capability, cost, recovery time, and workflow.
A strong system gives employees flexibility while screening out trades that create predictable problems. Start with five approval gates, automate the rules you can, and measure the results. The most productive schedule is not the one with the fewest changes; it is the one that absorbs change without losing the conditions people need to perform well.
-

Overtime Productivity Decline Studies: Where Extra Hours Stop Paying Off
A longer workweek can add paid hours without adding much useful output. That is the central lesson running through overtime productivity decline studies: after a point, fatigue, slower decisions, mistakes, and weaker recovery begin consuming the gains that extra time was meant to create.
For U.S. employers, this matters beyond payroll. Overtime can absorb a short demand spike, but repeated 50-, 60-, or 70-hour weeks can change project economics because the last hours may be far less productive than the first.
What the Strongest Studies Actually Show
Stanford economist John Pencavel analyzed historical production records from British munitions workers and found a nonlinear relationship between hours and output. Production rose with hours initially, but gains from each additional hour became progressively smaller once weekly hours were already high. Stanford has also summarized his finding that output per hour falls as workers move beyond roughly 48 hours in a week.
The study does not prove every modern workplace has the same cutoff. Its importance is the pattern: hours and output do not keep rising one-for-one indefinitely. Stanford Institute for Economic Policy Research: The Productivity of Working Hours.
Pencavel’s later research also examined recovery. Long workweeks can affect subsequent performance because workers have less time away from work to restore their physical, mental, and emotional capacity.
Safety Data Shows Another Side of Productivity Loss

Productivity is not only units completed per hour. Injuries, errors, rework, absence, and failed handoffs consume productive capacity too.
A major U.S. study by Allard Dembe and colleagues analyzed 110,236 job records representing 89,729 person-years of work. After adjustments for factors including occupation, industry, age, gender, and region, jobs involving overtime schedules were associated with a 61% higher injury hazard rate.
Working at least 12 hours per day was associated with a 37% higher hazard, while working at least 60 hours per week was associated with a 23% increase.
Those figures measure injury hazards rather than direct productivity losses. Even so, workplace injuries can interrupt production, require replacement labor, create administrative work, and delay schedules.
NIOSH reviewed 52 studies examining long working hours, health, injuries, and performance. Its review found recurring evidence of declining alertness and cognitive function during extended work period, particularly during the ninth through twelfth hours of long shifts.
Current CDC guidance also notes that fatigue can slow reaction time, reduce concentration, affect short-term memory, and impair judgment.
Why 50 to 55 Hours Gets So Much Attention
The 50- to 55-hour range appears frequently in discussions of overtime productivity decline studies because several research streams show deterioration around extended weekly schedules. It should be treated as a warning zone, however, not a universal biological cutoff.
Task type changes the curve. Software development, medicine, logistics, construction, and manufacturing impose different cognitive and physical demands. Sleep, commute time, night work, heat exposure, autonomy, and consecutive workdays can also affect how quickly performance falls.
That is why claims such as “70 hours produces exactly the same output as 55 hours” should not be applied universally. The more defensible finding is that marginal output can become very small at high weekly hours while payroll costs continue increasing.
Work pattern Research signal Practical implication Around 40 hours Useful productivity baseline Track normal output and errors Above roughly 48–50 hours Diminishing output gains in Pencavel’s historical data Treat added hours as lower-yield time 12-hour days 37% higher injury hazard in one U.S. study Watch fatigue and safety indicators 60+ hours weekly 23% higher injury hazard in the same study Use sustained schedules cautiously Repeated long weeks Recovery may affect later performance Track the following week’s results A Simple Overtime Productivity Test
Managers do not need an academic model to identify diminishing returns. They need consistent operational data.

1. Establish Your Normal Baseline
Calculate output per paid hour during weeks with little or no overtime. Depending on the business, that might mean orders shipped, customer cases resolved, production units, installations completed, or accepted deliverables.
Stanford defines labor productivity around the relationship between output and hours worked. That same principle can be applied at a team or department level.
2. Calculate Overtime Yield
Use a simple calculation:
Overtime yield = incremental output gained ÷ overtime hours added
Suppose a team normally completes 10 accepted units per labor hour. Ten additional overtime hours produce only 45 additional units.
The overtime yield is 4.5 units per hour—less than half the team’s normal hourly rate.
That does not automatically make the overtime unprofitable, but it tells managers that each added hour is delivering substantially less output.
3. Count the Hidden Costs
Add defects, customer corrections, injuries, absenteeism, late starts, rework, and supervisor time spent repairing mistakes.
A schedule can appear highly productive on Friday evening while generating additional costs on Monday and Tuesday.
4. Create a Stop Rule
Set a measurable trigger for reconsidering overtime.
For example, a company might reduce overtime when its overtime yield remains below 70% of normal productivity for two consecutive weeks or when rework rises significantly.
That 70% figure is an internal management example, not a research-backed universal threshold. Each organization should choose a level that reflects its margins, workload, safety exposure, and staffing alternatives.
Overtime Can Still Make Economic Sense
Overtime is not automatically inefficient.
A short burst may be rational when demand is temporary, a deadline has real financial consequences, experienced workers are available, and hiring or onboarding temporary staff would cost more than extending current schedules.
The problem begins when exceptional overtime becomes the normal staffing strategy.
The International Labour Organization’s research synthesis reports a broader association between longer working hours and lower unit labor productivity, while reductions in working time can support productivity under appropriate conditions.
A two-day push before a major launch is fundamentally different from months of six-day, 60-hour workweeks. Duration and recovery matter.
What Employers Should Change Before Adding More Hours

Start with workload design. Remove unnecessary meetings, reduce handoff friction, fix equipment downtime, automate repetitive administrative work, and distinguish genuinely urgent tasks from work that simply entered the process late.
Spread critical responsibilities across trained employees instead of repeatedly assigning overtime to the same top performers. Protect meaningful recovery periods between extended shifts, especially where work involves driving, machinery, medical decisions, or physical hazards.
Most importantly, track output per labor hour alongside total weekly output. A team can produce more during a 60-hour week than during a 40-hour week while simultaneously becoming much less productive during each additional hour. That distinction is where many overtime decisions go wrong.
Frequently Asked Questions
1. Do workers become less productive after 50 hours a week?
Often, but not at an identical threshold in every occupation. Research indicates diminishing output at high weekly hours, while workload, sleep, recovery, and job demands influence when decline begins.
2. Is a 60-hour workweek always less productive than a 40-hour week?
No. Total output may still increase temporarily. The concern is that productivity per additional hour can fall while fatigue, errors, injury risk, and recovery costs increase.
3. What does U.S. research say about overtime injuries?
One large longitudinal U.S. study associated overtime schedules with a 61% higher injury hazard. Twelve-hour days and 60-hour weeks were also associated with elevated hazards.
4. How should employers measure overtime productivity?
Compare incremental output generated during overtime with normal output per hour, then account for rework, errors, injuries, absenteeism, and performance during subsequent workdays.
The Real Cost Appears at the Margin
The useful question is not whether people can work additional hours. They clearly can. The question is what the final hour produces after fatigue, mistakes, recovery loss, and labor costs are counted.
That is why overtime productivity decline studies have practical value for managers. They replace the assumption that more time automatically creates proportionally more output with something measurable. Track the productivity of additional hours, examine what happens afterward, and scale overtime back when its marginal return stops justifying the cost. The strongest overtime strategy is not the one that maximizes hours. It is the one that protects productive hours.
-

Productivity Metrics Every Operations Manager Should Track to Find Hidden Waste
A team can look busy all day and still become less productive. That distinction matters because activity is not the same as output. The U.S. Bureau of Labor Statistics measures labor productivity by comparing real output with hours worked—not by counting emails, meetings, logins, or visible effort.
For operations leaders, that principle should shape the dashboard. The most useful productivity metrics every operations manager should track reveal whether labor, equipment, time, quality, and spending are producing more customer value or simply generating more activity.
Start With Output per Labor Hour
Output per labor hour is one of the cleanest measures of frontline productivity.
The calculation is straightforward:
Output per labor hour = completed output ÷ total labor hours
If a distribution team ships 4,800 orders during 600 labor hours, productivity equals eight orders per labor hour. If output rises to 5,400 while labor hours remain unchanged, productivity has improved without adding staffing hours.
This mirrors the basic approach used by the U.S. Bureau of Labor Statistics, which defines labor productivity as output relative to hours worked.
The metric becomes much more useful when managers compare similar periods, teams, shifts, facilities, or workflows rather than treating one number as universally good or bad.
Recent BLS data also illustrates why productivity deserves attention. In the second quarter of 2026, U.S. nonfarm business productivity was 2.2% higher than a year earlier while output rose 2.5% and hours worked increased only 0.2%.
Measure How Long Work Actually Takes

Cycle time exposes bottlenecks
Cycle time tracks how long a repeatable process takes to complete. The Lean Enterprise Institute defines it as the measured time needed to produce a part or complete a process.
An operations manager might track minutes per customer request, hours per repair, seconds per production unit, or days per order.
Average cycle time is useful, but averages can hide problems. A process averaging 40 minutes may consist of half the jobs taking 20 minutes and the other half taking an hour.
Track the median and unusually slow cases as well. Those outliers often expose equipment downtime, approvals, missing information, staffing gaps, or handoff problems.
Separate cycle time from lead time
These terms are often confused. Cycle time generally focuses on the time required to perform a process. Lead time may include everything the customer waits through—queues, scheduling delays, processing, inspection, and delivery.
Operations managers should monitor both when customer experience depends heavily on waiting.
Track Utilization Without Trying to Max It Out
Utilization measures how much available capacity is being actively used. For a worker, team, machine, or facility:
Utilization rate = productive operating time ÷ available capacity × 100
A machine running productively for six hours during an eight-hour available period has 75% utilization.
But higher is not automatically better.
Running every onboarding employee checklist or machine near maximum capacity can leave little room for maintenance, urgent jobs, training, demand spikes, delays, or process variation. That is why a generic claim that every operation should target the same 75% or 85% utilization level is misleading.
NIST manufacturing guidance recognizes utilization as one of several performance measures alongside process efficiency, value-added time, conformance, and overall equipment effectiveness.
Treat utilization as capacity information—not a contest to reach 100%.
Watch Quality Before Celebrating Speed
A process that produces more units but creates more mistakes has not necessarily become more productive.

First-pass yield
First-pass yield measures how much work clears a process correctly without requiring repair, retesting, reruns, or rework.
The American Society for Quality defines first-pass yield as the percentage of units that complete a process while meeting quality requirements without being scrapped, rerun, retested, returned, or routed for repair.
Suppose 1,000 orders are processed and 930 are completed correctly the first time.
First-pass yield is 93%.
The missing 7% deserves attention because rework consumes labor and capacity without creating additional customer value.
Rework rate
Track rework separately when corrections are expensive or common.
A falling cycle time combined with rising rework can indicate that teams are moving faster by sacrificing accuracy. Looking at both metrics prevents that false productivity signal.
Use Cost per Unit to Connect Productivity With Money
Output tells managers whether work is getting done. Cost per unit tells them whether it is getting done economically.
Cost per unit = total relevant operating cost ÷ units completed
Depending on the operation, relevant costs may include direct labor, materials, energy, machine time, packaging, or other variable expenses.
Managers should compare cost per unit with output per labor hour. If employees are producing more units per hour but overtime, waste, defects, or maintenance expenses are rising faster, the financial benefit may disappear.
BLS uses a related economy-level concept called unit labor costs, which connects hourly compensation with productivity.
Monitor Overtime as an Early Warning Metric
A productive month can hide an unsustainable operating model.
Repeated overtime may temporarily protect output, but it can also indicate inaccurate demand forecasts, poor shift design, vacancies, weak processes, or inadequate capacity.
OSHA warns that extended or irregular work periods can contribute to fatigue, reduced alertness, impaired decision-making, and lost productive work time.
Managers should therefore review overtime alongside output, absenteeism, defects, safety incidents, and schedule adherence. A spike during a seasonal surge may be reasonable. A permanent upward trend deserves investigation.
Add Schedule Adherence and Completion Rate
Schedule adherence asks a practical question: Did the operation complete what it planned to complete when it planned to complete it?
It can be measured through on-time work orders, production plans, service appointments, shipments, or project milestones.

Task completion rate adds another view:
Completion rate = completed scheduled work ÷ scheduled work × 100
Neither metric should stand alone. A team can achieve 100% completion by setting extremely conservative schedules.
That is why productivity metrics every operations manager should track should work as a system rather than a collection of isolated targets.
The Operations Dashboard That Connects the Signals
Metric What it reveals Warning sign Output per labor hour Workforce efficiency Falling output with stable hours Cycle time Process speed Increasing completion time Utilization Capacity use Chronic overload or persistent idle capacity First-pass yield Quality More corrections and defects Cost per unit Economic efficiency Costs rising despite higher output Overtime hours Capacity pressure Sustained dependence on extra hours Schedule adherence Reliability Increasing missed commitments The strongest dashboard lets managers examine relationships between these numbers.
If output falls while utilization stays high, the process may have a bottleneck. If output increases while first-pass yield declines, speed may be creating errors. If schedule adherence improves productivity metrics for analysis, only because overtime keeps rising, staffing or capacity may be inadequate. That context is where operational measurement becomes useful.
A Four-Step Test Before Adding Any KPI
Before placing another metric on the dashboard, ask four questions.
- First, does the metric connect to an operational outcome? Measuring something simply because software can collect it creates noise.
- Second, can a manager act on the result? If no operational decision changes when the metric moves, it probably belongs in a lower-level report.
- Third, can employees influence it? Holding teams accountable for outcomes beyond their control creates misleading performance comparisons.
- Fourth, does another metric balance it? Speed needs quality. Utilization needs workload context. Output needs cost. Delivery performance needs capacity information.
This prevents managers from optimizing one number while damaging the larger operation.
FAQs
1. What is the most important operations productivity metric?
Output per labor hour is a strong starting point because it directly connects production with labor input. It should still be evaluated alongside quality, cost, and cycle time.
2. How often should operations metrics be reviewed?
High-volume operational metrics may need daily monitoring, while broader productivity, cost, and workforce trends can be reviewed weekly or monthly depending on the business.
3. Is 100% employee utilization a good goal?
Usually not. Maximum utilization leaves little capacity for training, maintenance, unexpected demand, urgent work, or process variation.
4. What is the difference between productivity and efficiency?
Productivity compares output with inputs such as labor hours. Efficiency considers how economically resources, time, capacity, or costs are used while producing that output.
Measure What Helps You Change the Operation
The best operations dashboard is rarely the one displaying the most numbers. It is the one that makes hidden problems visible early enough to fix them.
Start with output per labor hour, then connect it with cycle time, utilization, quality, cost, overtime, and delivery reliability. Together, these productivity metrics every operations manager should track show whether higher output represents genuine improvement or merely faster work, longer hours, and deferred problems.
Busy operations generate activity. Well-measured operations turn activity into reliable, economical output.
-

Reducing Absenteeism to Protect Team Productivity Without Creating a Culture of Fear
An empty workstation rarely represents just eight lost labor hours. The work may shift to another employee, a customer may wait longer, overtime may rise, and an already stretched team may become more fatigued.
That multiplier effect is why reducing absenteeism to protect team productivity requires more than enforcing attendance rules. CDC’s National Institute for Occupational Safety and Health tracks health-related workplace absence because changing absence patterns can reveal illness and workforce-health problems across industries.
For employers, the objective should not be zero absence. People get sick, care for family members and sometimes qualify for legally protected leave. The practical goal is to reduce preventable, recurring disruption while making legitimate time away from work manageable.
Why One Absence Can Affect an Entire Team
Absenteeism becomes expensive when work is tightly interconnected. It is crucial to manage frequently absent employees wisely.
Imagine a six-person operations team in which one employee unexpectedly misses a shift. That is technically a 16.7% reduction in available headcount. But productivity may fall by more than 16.7% if the missing employee operates specialized equipment, handles approvals or performs a task required before everyone else can proceed.
The remaining employees may then work faster, skip breaks or stay late. Repeated often enough, that response creates another problem: fatigue.
OSHA warns that long and irregular working hours can contribute to stress, illness and worker fatigue while increasing the risk of accidents and injuries. NIOSH likewise identifies reduced productivity, errors, absenteeism and turnover among the potential consequences of demanding schedules and long hours.
The lesson for managers is simple: covering every absence with overtime can protect today’s schedule while weakening tomorrow’s workforce.
Find the Reason Before Trying to Fix the Number
Attendance data tells managers that something happened. It rarely explains why. Recurring absences may reflect illness, caregiving responsibilities, unreliable transportation, burnout, scheduling conflicts, workplace injuries, poor supervision or inflexible shift design. Treating all of these situations as the same attendance problem can produce the wrong solution.

A better investigation begins with patterns rather than individual assumptions.
Use a Monthly Absence Diagnostic
Managers can calculate:
Absence rate = days lost to unscheduled absence ÷ total available workdays × 100
For example, suppose 20 employees provide 400 available workdays during a month and 16 workdays are lost.
16 ÷ 400 × 100 = 4% absence rate
The percentage itself is only a starting point. Compare it by shift, department, weekday and season.
Pattern noticed What managers should examine Absences cluster on one shift Scheduling, supervisor practices, fatigue Absences rise after overtime periods Workload and recovery time Many employees become absent together Infectious illness or workplace conditions One role has repeated disruption Job design, physical demands, staffing Monday/Friday absences repeatedly increase Scheduling patterns and individual circumstances CDC uses workforce absence trends partly because unusually high health-related absence can signal increased illness in particular occupations or demographic groups. Employers can apply the same principle internally: look for signals before assigning blame.
Give Employees More Ways to Stay Productive
A worker who needs two hours for an appointment should not always have to lose an entire workday.
Where the role permits it, flexible start times, schedule swaps, remote work, compressed hours or temporary task modifications can prevent a small personal constraint from becoming a complete absence.
NIOSH’s Total Worker Health program specifically identifies flexible work, supportive supervision and avoidance of unpredictable, demanding schedules as workplace practices that can benefit both workers and organizations.
Flexibility will not work equally well everywhere. A machine operator, nurse, warehouse picker or restaurant employee cannot simply finish every task from home. In those environments, better shift-swapping systems, cross-training and predictable scheduling can provide some of the same resilience.
Stop Treating Wellness Programs as a Quick Fix
Employers often respond to absenteeism by launching a wellness initiative. Evidence suggests that deserves more scrutiny.

A large randomized workplace study reported by Harvard found improvements in some health behaviors but no significant short-term improvement in absenteeism or job performance.
That does not mean employee health is irrelevant. It means installing a wellness portal while leaving excessive workloads, unpredictable shifts or weak management untouched is unlikely to solve the underlying problem.
Harvard’s Center for Work, Health, and Well-being emphasizes that working conditions themselves influence worker health, safety and organizational outcomes including productivity, turnover and absence.
So start with job design. Ask whether schedules are realistic, workloads sustainable, breaks usable and supervisors supportive before assuming employees simply need more wellness resources.
Make Attendance Policies Clear but Not Punitive
Employees should know exactly how to report an absence, whom to contact, how much notice is expected when possible and how documentation requirements work.
Consistency matters. If two employees receive dramatically different responses to similar circumstances, the attendance policy becomes harder to trust.
However, reducing absenteeism to protect team productivity cannot mean discouraging workers from taking legitimate medical leave.
The U.S. Department of Labor explains that eligible employees of covered employers can receive up to 12 workweeks of job-protected FMLA leave for qualifying family and medical reasons. Eligibility and employer-coverage rules apply, and medically necessary intermittent leave may also qualify.
State and local requirements may add further protections. Employers should therefore have HR or qualified employment counsel review attendance systems rather than automatically disciplining repeated medical absence.
There is another reason to avoid overly aggressive attendance rules. Research published in 2026 using data on service workers at 63 large firms found that exposure to points-based attendance systems was associated with substantially more presenteeism—employees reporting to work despite being sick enough to warrant absence.
Getting sick employees through the door is not necessarily a productivity victory.
Build Capacity for the Days Absence Still Happens

Some absence is unavoidable. But it is important to balance shift swap productivity loss. High-performing teams plan for that reality.
Cross-train employees on critical duties. Document essential processes. Identify which jobs require immediate coverage and which tasks can safely wait. Maintain an escalation process for unexpectedly understaffed shifts.
Managers should also distinguish urgent work from work that merely feels urgent. If five people are expected to complete six people’s normal workload every time someone calls out, the organization has not created an absence plan; it has transferred the absence cost to the remaining employees.
Encouraging employees to use earned vacation time can also help protect recovery time instead of allowing chronic exhaustion to accumulate.
A Five-Question Absenteeism Check for Managers
Before introducing another attendance rule, ask:
- Where are absences concentrated? Look by team, shift, job and time period.
- What changed before the pattern appeared? Check overtime, staffing, schedules and management changes.
- Can a partial-day solution prevent a full-day absence?
- Are legitimate health and protected-leave situations handled correctly?
- Can the team absorb an absence without repeatedly overworking everyone else?
If several answers expose operational problems, stricter enforcement alone is unlikely to solve them.
Frequently Asked Questions
1. What is the most effective way to reduce employee absenteeism?
Identify the causes first. Combine reliable attendance data with manageable workloads, predictable scheduling, flexibility where practical, supportive management and clear policies rather than relying solely on disciplinary measures.
2. How does absenteeism affect team productivity?
Absence can delay work, redistribute tasks, increase overtime and interrupt dependent workflows. The productivity impact can therefore extend beyond the hours lost by the absent employee.
3. Should employers reward perfect attendance?
Use caution. Incentives that encourage sick employees to work may increase presenteeism or conflict with protected leave. Policies should reward reliability without discouraging legitimate time off.
4. How often should managers review absenteeism data?
Monthly reviews help identify emerging patterns. Larger organizations may also conduct quarterly comparisons across shifts, departments, job types and seasonal periods.
Protect the Team, Not Just the Attendance Number
An absence metric can improve while the underlying workplace gets worse. Employees may report sick, exhausted or distracted simply because they fear a penalty.
The stronger approach is reducing absenteeism to protect team productivity by fixing preventable causes, planning for unavoidable absences and preserving legitimate leave. Track patterns, examine scheduling and workload, create flexibility where the job allows it, and cross-train critical work.
The most useful attendance question is therefore not, “How do we get everyone to show up?” It is, “What keeps reliable employees able and willing to keep showing up?”
-

How Mobile Productivity Apps Increase Efficiency for Field Staff Without Adding More Work
A field technician who spends 15 minutes calling the office for job history, another 10 filling out paperwork, and 20 minutes driving an avoidable route has lost nearly an hour without doing the work the customer actually requested.
That is the real reason how mobile productivity apps increase efficiency for field staff matters. The biggest gains rarely come from asking technicians to work faster. They come from removing waiting, duplicate data entry, unnecessary trips, missing information, and communication gaps.
For US construction crews, utility technicians, HVAC teams, inspectors, maintenance workers, delivery operations, and other mobile workforces, a well-designed app can turn a phone or tablet into a job file, dispatch center, navigation tool, camera, checklist, and communication channel.
The Real Productivity Problem Is Friction Between Jobs
Field productivity is often measured by completed work orders or billable hours. But those numbers can hide enormous amounts of nonproductive time.
A technician may arrive without the correct equipment information. Another worker may finish a job but wait until evening to enter handwritten notes. A dispatcher may repeatedly call employees asking where they are. Customer signatures may remain on paper until someone brings them back to the office.
Mobile workforce technology closes those gaps by putting information where the work happens.
The US Department of Energy’s guidance on fleet telematics and efficient fleet management explains that telematics can streamline reporting, track vehicle utilization and provide near-real-time GPS information. Although aimed at federal fleets, the operational principle applies broadly: information captured automatically in the field requires less manual reconstruction later.
Paperwork Becomes Part of the Job Instead of a Second Job
Paper forms create work twice. Technicians first record information manually, and someone may later enter the same information into billing, inventory, compliance, CRM, or service-management systems.
Mobile forms can capture job details once. Photos, timestamps, equipment readings, customer approvals and digital signatures can become part of the work order before the technician leaves the site.
That reduces transcription errors as well as administrative delays. A useful model is:
Traditional workflow: perform job → write notes → return paperwork → enter data → review → invoice.
Mobile workflow: perform job → record data during work → sync → trigger review or billing.
The important improvement is not simply replacing paper with a screen. The app should eliminate a later step.
Offline Capability May Matter More Than Fancy Features
Field crews do not work exclusively in places with strong Wi-Fi or cellular service.
Mechanical rooms, basements, rural properties, warehouses, construction sites and remote infrastructure can all produce unreliable connectivity. An application that becomes unusable without a connection may actually create more delays than it solves.
Offline-first apps allow technicians to access downloaded job information, complete forms, take photos and record notes locally. Changes synchronize once connectivity returns.
Penn State Extension provides a useful real-world example. Its Crop Manager platform introduced mobile field data collection with offline capabilities, allowing users to gather information where reliable connectivity may not exist.
That is a good test for any field application: What can an employee still accomplish when the signal disappears?
If the answer is “almost nothing,” the software may not be designed for real field conditions.
Better Scheduling Cuts the Invisible Cost of Driving
Travel is necessary for many field businesses, but inefficient travel is not.
GPS-enabled workforce applications can connect dispatching, technician location, service territories and appointment schedules. Instead of simply assigning the next open worker, organizations can consider location, qualifications, job priority and estimated travel time.
The Department of Energy specifically recommends using GPS and telematics to improve scheduling and routing because better routes can reduce travel time and distance.
Consider two schedules containing six jobs each. Both appear equally productive on paper.
If Schedule A requires 140 miles of driving and Schedule B requires 95 miles while completing the same work, the second schedule creates 45 miles of capacity that can potentially be redirected toward another appointment, reduced overtime or earlier completion.
That is why route optimization should be viewed as workforce productivity technology, not merely navigation.
Technicians Can Carry the Company’s Knowledge With Them

One of the most expensive field delays occurs when the worker reaches the customer but lacks information.
Mobile apps can make equipment histories, previous repairs, customer notes, diagrams, manuals, warranties, parts information and inspection records available at the jobsite.
That changes troubleshooting.
Instead of calling the office to ask what happened during the last visit, the technician can review the service history immediately. Instead of discovering that a component was recently replaced after beginning a diagnosis, that information can appear before work starts.
This also reduces dependence on individual memory. Knowledge remains attached to the customer, asset or work order rather than disappearing when cost of employee turnover is unavailable.
Mobile Apps Can Support Safer Decisions, Too
Efficiency should not mean rushing field workers through hazardous conditions.
Mobile technology can place safety information directly at the point of work. The National Institute for Occupational Safety and Health maintains mobile applications for workplace risks including heat, ladder use, hazardous chemicals, lifting and occupational noise.
OSHA also provides mobile tools and digital resources, including the OSHA-NIOSH Heat Safety Tool, which helps workers assess outdoor heat conditions and appropriate protective actions.
These examples demonstrate a broader principle: the best field applications do not merely capture what employees did. They help workers make better decisions before and during the task.
Where the Efficiency Gains Actually Come From
Field problem Mobile capability Potential operational gain Re-entering handwritten forms Digital forms and automatic syncing Less administrative work Missing service information Centralized job history Faster diagnosis Excess driving GPS-assisted dispatch and routing More productive field time Poor connectivity Offline data access Fewer interrupted workflows Repeated office calls Status updates and messaging Less coordination time Delayed job documentation Photos, signatures and timestamps Faster job closure The lesson is important: how mobile productivity apps increase efficiency for field staff depends less on the number of features available and more on whether those features remove a specific operational bottleneck.
A Six-Point Test Before Choosing a Field Productivity App

Before purchasing software, managers should follow one work order from beginning to end and identify where time disappears. Know about Fair Workweek compliance for your business.
Then evaluate the application against six questions:
- Can technicians complete core tasks without reliable internet access?
- Can job information be entered once instead of copied between systems?
- Does the app integrate with scheduling, CRM, inventory or billing systems already in use?
- Can workers retrieve service history and technical information at the jobsite?
- Does routing reduce unnecessary travel rather than simply display a map?
- Can managers measure adoption, completion times, travel time and repeat visits?
A pilot involving a small group of technicians can reveal problems that a software demonstration will never show.
Measure performance before and after deployment. Useful metrics include administrative minutes per work order, jobs completed per technician, miles per job, first-time completion rate, overtime hours and time between job completion and invoicing.
Productivity Apps Also Create New Risks
Giving employees instant access to company data means organizations must protect that access.

The National Institute of Standards and Technology notes that mobile devices provide valuable access to workplace resources but can also expose sensitive information if they are poorly secured. NIST recommends managing mobile security throughout the device lifecycle and considering centralized device management and endpoint protection.
Businesses should therefore consider authentication, remote device management, access permissions, encryption, software updates and procedures for lost or stolen devices.
More technology can also become less productive when employees must jump between several disconnected apps. A technician who uses one platform for scheduling, another for forms, another for messages and another for photos may simply exchange paper clutter for digital clutter. Integration matters more than app count.
FAQs
1. How do mobile apps make field workers more productive?
They reduce manual paperwork, provide job information on-site, improve scheduling, support faster communication and allow workers to document completed work without returning to an office.
2. Why is offline functionality important for field service apps?
Field employees often work where cellular coverage is unreliable. Offline functionality lets them continue accessing information and recording work, then synchronize data when connectivity returns.
3. Can mobile productivity apps reduce travel time?
Yes. Apps that combine scheduling with GPS, technician location and routing can help dispatchers reduce unnecessary mileage and assign jobs more efficiently.
4. What should managers measure after implementing an app?
Track completed jobs, administrative time, miles traveled, overtime, first-time completion rates, repeat visits and how quickly completed jobs reach billing or other downstream systems.
The Best App Should Make Work Disappear
The clearest measure of how mobile productivity apps increase efficiency for field staff is not how often workers open the software. It is how much unnecessary work disappears after they begin using it.
A productive field application should mean fewer phone calls, fewer handwritten forms, fewer unnecessary miles, fewer searches for information and fewer hours spent reconstructing what happened after a job.
Start with one inefficient workflow rather than a long software feature list. Fix that workflow, measure the result and expand from there. The most valuable productivity technology is often the technology that quietly gives field workers their time back.
-

The Impact of Predictable Scheduling on Overall Workplace Productivity Is Bigger Than the Calendar
A retail scheduling experiment produced a result that should get any operations manager’s attention: more stable employee schedules were associated with a roughly 7% increase in median sales and a 5% increase in labor productivity.
The experiment, conducted across 28 Gap stores in the San Francisco and Chicago areas, challenged a familiar assumption that businesses must constantly change employee hours to operate efficiently. Instead, the impact of predictable scheduling on overall workplace productivity can extend from better attendance and retention to stronger customer service, employee focus, and revenue.
The lesson is not that every shift must become rigid. It is that uncertainty carries an operating cost that businesses often fail to calculate.
Unpredictable Scheduling Is More Common Than It Looks
Schedule variability affects a significant share of American workers.
The U.S. Bureau of Labor Statistics reported that work schedule variability was present for 48.3% of workers in its 2025 Occupational Requirements Survey. BLS defines this variability as situations where employers require employees to work different days, times, or numbers of hours from week to week.
Not all variability is harmful. Nurses, restaurant employees, construction crews, warehouse teams, retailers, and hospitality businesses may genuinely need schedules that respond to demand.
The problem begins when employees cannot reasonably anticipate when they will work. Someone who receives a schedule only days before a shift may have to rearrange child care, transportation, education, medical appointments, or a second job. A last-minute cancellation creates a different problem: the worker has reserved time for work but loses expected income.
CLASP has documented how unstable schedules can make arranging transportation, child care, education, budgeting, and second jobs more difficult, especially for lower-wage employees. Those problems eventually return to the workplace.
Why Schedule Predictability Can Raise Productivity
Predictability improves productivity through several connected mechanisms rather than one dramatic change.
Employees Can Actually Prepare to Be at Work
Advance notice gives workers time to solve logistical conflicts before their shifts begin.
That sounds basic, but transportation problems or unavailable child care can quickly become late arrivals, emergency shift swaps, absenteeism, or manager time spent finding replacements.
UC Berkeley research examining service-sector workers has found that employees facing just-in-time scheduling reported greater difficulty arranging child care and were more likely to miss work because child care could not be arranged.
A predictable schedule therefore does more than make life convenient. It can remove preventable causes of attendance disruption.
Experienced Employees Become Easier to Retain
Turnover has a productivity cost that is easy to overlook.

Every departure can mean recruitment, onboarding, training, supervisory time, and weeks or months before the replacement reaches the productivity of an experienced employee.
Researchers involved in the Gap stable-scheduling experiment reported improved retention among more senior employees, who already possessed stronger knowledge of products and operating processes. Researchers identified that retention as one possible explanation for the productivity improvement.
Schedule stability therefore protects something businesses have already paid to develop: employee experience.
Less Uncertainty Can Improve Performance During the Shift
Having enough employees on the floor does not guarantee that each person will perform equally well.
Research summarized by Brookings examined approximately 1.4 million transactions across 25 U.S. restaurant locations. Servers working real-time schedule extensions generated check sizes about 4.4% lower than those working regularly scheduled shifts. Researchers linked much of the difference to reduced cross-selling and upselling.
Interestingly, short-notice shifts did not produce the same overall reduction.
That distinction matters. The operational problem is not simply “schedule changes.” Extremely late uncertainty appears particularly important.
What the Gap Experiment Revealed
One of the strongest pieces of U.S. evidence comes from the Stable Scheduling Study.
Researchers tested scheduling changes involving approximately 1,500 employees and more than 150,000 shifts. Participating stores introduced measures including more consistent shift times, improved advance predictability, greater employee control over shift exchanges, and targeted minimum hours for certain employees.
The results were commercially meaningful.
Measure Reported result Sales +3.3% in later published analysis Labor hours -1.8% Sales per labor hour +5.1% Ability to anticipate weekly hours Higher in intervention stores WorkRise’s review of the published research found that productivity increased even though labor hours fell, meaning the stores were generating more output from the hours employees worked.
That is an important distinction. Predictable scheduling should not be viewed simply as an employee benefit added to operating costs. Done well, it can become part of workforce optimization.
A Simple Predictability Test Managers Can Use
Managers do not need to wait for a company-wide scheduling overhaul to identify problems. Review the previous eight weeks of schedules and calculate four numbers.

1. Advance-notice rate
Measure the percentage of shifts employees knew about at least two weeks beforehand. A higher percentage indicates greater planning certainty.
2. Last-minute change rate
Count employer-initiated schedule additions, reductions, cancellations, or time changes made close to the scheduled shift.
Separate voluntary employee swaps from employer changes so the measurement reflects true scheduling instability.
3. Hours consistency
Compare each employee’s scheduled weekly hours with their actual hours. Someone scheduled for 28 hours one week, 12 the next, and 32 after that technically has employment but little income predictability.
4. Operational consequences
Compare unstable scheduling periods against absenteeism, lateness, overtime, turnover, sales per labor hour, prevent burnout while facing customer complaints, and manager time spent filling vacancies. This turns scheduling from an HR discussion into measurable operations data.
Predictable Does Not Mean Completely Fixed
The impact of predictable scheduling on overall workplace productivity can be misunderstood if managers assume predictability requires identical hours every week.
That is rarely practical. Restaurants face unexpected customer volume. Retailers experience promotions and seasonal peaks. Health care organizations encounter changing patient needs. Manufacturers deal with production interruptions. The better objective is structured flexibility.
Employers can publish core schedules early, forecast demand using historical data, maintain voluntary pools for additional shifts, allow simple shift exchanges, and reserve last-minute changes for genuine exceptions.
This approach gives managers flexibility without transferring every forecasting error to employees.
Some research even suggests moderate short-notice adjustments can be less damaging than same-day changes. The restaurant study discussed by Brookings found no statistically significant overall check-size difference during short-notice shifts, while real-time scheduling produced the larger performance decline.
Schedule Control Matters Alongside Advance Notice
Publishing schedules early solves only part of the problem.

An employee who receives a three-week schedule but has no practical way to request changes may still experience conflicts.
The Gap experiment combined predictability with employee control. Workers could use scheduling technology to add, drop, or exchange eligible shifts. WorkRise reported that 62.2% of eligible part-time nonmanagerial workers at intervention stores used the scheduling application at least once.
The strongest system therefore combines three things: reasonable advance notice, consistency in expected hours, and a controlled process for employee-driven changes.
There Are Limits to What Scheduling Can Fix
Predictable schedules cannot compensate for chronic understaffing, poor management, inadequate training, unsafe workloads, or fundamentally inaccurate demand forecasts. They also cannot guarantee that every worker wants identical stability.
Some students, caregivers, gig workers, and employees seeking additional income may prefer flexible opportunities to accept extra shifts. Research on Oregon’s predictive scheduling system also found workers sometimes volunteered for standby lists because they wanted additional hours.
The objective should therefore be predictable core employment plus voluntary flexibility—not eliminating flexibility entirely.
FAQs
1. What is predictable scheduling?
Predictable scheduling means employees receive reasonable advance notice of their shifts, experience fewer unexpected changes, and can anticipate roughly when and how much they will work.
2. How does predictable scheduling improve employee productivity?
It can reduce logistical conflicts, improve attendance, support retention, lower employee uncertainty, and help experienced workers remain focused and available during scheduled hours.
3. Does predictable scheduling increase business costs?
Not necessarily. Stable scheduling may require operational changes, but U.S. retail research found improved sales and labor cost productivity even while total labor hours declined.
4. How far in advance should employers publish schedules?
There is no universal operational standard. Two weeks is a useful benchmark for many workplaces, although business needs and applicable state or local scheduling laws can differ.
Better Schedule Is an Operating System, Not Just a Calendar
The most important impact of predictable scheduling on overall workplace productivity may be what does not happen: fewer emergency replacements, fewer avoidable absences, less manager time rebuilding schedules, and less accumulated knowledge walking out the door.
Businesses still need flexibility. Demand will never become perfectly predictable.
But the evidence suggests that maximum scheduling flexibility and maximum operating efficiency are not the same thing. Managers should measure schedule instability exactly as they measure overtime, turnover, labor utilization, or sales per hour. Once uncertainty becomes a measurable operating cost, publishing a better schedule stops looking like an employee perk and starts looking like productivity management.
-

How Real-Time Workforce Data Improves Employee Scheduling Decisions Across Teams
I started noticing how quickly a perfectly reasonable employee schedule can become outdated. A person calls out, customer traffic suddenly picks up, or someone works longer than planned, and the schedule no longer reflects what is actually happening. When managers are working from yesterday’s information, even a small change can create a bigger staffing problem.
I also realized that scheduling is less about filling empty boxes on a calendar and more about making decisions with the information available at that moment. Real-time workforce data gives managers a clearer view of availability, attendance, demand, hours, and staffing gaps, making it easier to adjust schedules before a small issue turns into a shift-wide headache.
What Real-Time Workforce Data Actually Shows
Traditional scheduling often starts with information collected earlier: employee availability, expected demand, planned hours, and previous schedules. That information still matters, but it can become stale quickly. Real-time workforce data adds what is happening now.
Managers can see who has arrived, who is absent, which shifts remain uncovered, how many hours employees have worked, and where staffing levels are changing. Depending on the system, they may also see updated availability, time-off requests, skills, labor costs, and demand signals.
Making Staffing Decisions Around Actual Demand

Employee scheduling works better when staffing levels reflect the work coming through the door. A store may be quiet during one part of the day and crowded an hour later. A restaurant can experience an unexpected rush. A service team may receive more requests than forecast.
Real-time demand signals help managers recognize these shifts sooner. They can add coverage when demand rises, avoid unnecessary staffing when activity slows, and make smaller adjustments instead of rebuilding an entire schedule.
The result is not simply a fuller schedule. It is a schedule that better reflects operational reality.
Handling Absences Before They Become Bigger Problems
Last-minute callouts are one of the clearest examples of why live information matters. A schedule can look complete at 8 a.m. and have a serious gap minutes later.
Real-time workforce data can show the open shift, current employee availability, worked hours, and relevant qualifications. That gives managers a stronger basis for finding a replacement instead of contacting people randomly or relying on memory.
Tools built around workforce software for managing last minute employee callouts can make this process more organized. Managers can identify suitable employees, consider availability and workload, and communicate the change faster.
Keeping Labor Costs Under Control
Scheduling decisions also affect labor costs. An employee who stays late may push a shift toward overtime. Adding another person may solve a coverage issue but create unnecessary labor expense if demand has already dropped.
Real-time workforce information helps managers see planned hours alongside actual hours. That makes it easier to spot potential overtime, uneven workloads, or staffing decisions that may push labor spending beyond expectations.
Coordinating Multiple Teams and Locations

Cross-team scheduling becomes more complicated when several departments, stores, or locations share employees. Without a common view, one manager may see an understaffed team while another sees spare capacity.
Real-time visibility can make those differences easier to identify. If one location becomes unusually busy while another is quieter, managers can review current staffing before deciding whether employees can be reassigned or additional coverage is needed.
Skills also matter. A person who is available is not automatically the right person for every shift. Scheduling decisions may need to account for certifications, experience, role requirements, or other qualifications.
Turning Schedule Changes Into Conversations
Data only becomes useful when people can act on it. If a manager sees an open shift but has no practical way to reach available employees, the information does not solve the problem.
Two-way communication can connect the scheduling decision with the employee response. Workers may be able to receive a shift offer, confirm availability, request changes, or respond to an update without waiting for a long chain of messages.
This is where employee scheduling tools with two way communication can make real-time scheduling more practical. Managers get a clearer response from employees, while employees have a direct way to communicate changes that could affect staffing.
Building a More Responsive Scheduling Habit
The biggest shift is not simply moving from paper schedules to software. It is moving from decisions based mainly on assumptions to decisions informed by what is actually happening. When managers can see demand, attendance, availability, hours, skills, and coverage changes together, they have a stronger foundation for adjusting work as conditions change.
Good scheduling will always involve some uncertainty. People get sick, customers arrive unexpectedly, priorities move, and business needs change. Real-time workforce data cannot remove those variables, but it can make the response more informed, coordinated, and timely.
FAQs: How Real-Time Workforce Data Improves Employee Scheduling Decisions Across Teams
1. What is real-time workforce data?
It is current information about staffing, such as attendance, availability, hours worked, open shifts, demand, and employee qualifications.
2. How does real-time data improve scheduling?
It helps managers compare current staffing with actual operational needs and make adjustments before coverage gaps become larger problems.
3. Can real-time workforce data reduce overtime?
It can help managers identify employees approaching overtime and consider alternative coverage before additional hours are assigned.
4. Is real-time scheduling fully automated?
Not necessarily. Software can surface information and recommendations, but managers can still apply context and judgment before making scheduling decisions.
Why Responsive Scheduling Becomes a Team Advantage
A schedule is never completely separate from the working day. It affects customer service, employee workload, labor spending, and the ability of teams to respond when plans change. The more current the information behind those decisions, the easier it becomes to spot problems early and make sensible adjustments. The real advantage is not having more data for its own sake. It is having useful information at the moment a scheduling decision actually needs to be made. That makes scheduling less about reacting to surprises and more about keeping teams prepared as conditions change throughout the day.
The real advantage is not having more data for its own sake. It is having useful information at the moment a scheduling decision actually needs to be made.